

Intelligence is only available on Business tier plans.
Overview
A metric is a saved calculation over one event in your schema. It answers a question like “How much revenue did these members generate?” or “What share of this audience made a purchase?” Every metric combines three choices:- Event — The action you’re measuring, such as a purchase, a page view, or an email click.
- Aggregation — How Hightouch combines those events into a number, such as counting them, counting the members who performed them, or summing a property like order total.
- Filters (optional) — Which events count, such as only completed orders or only purchases in one product category.
Before you begin
- Your workspace must have a schema with a parent model.
- The parent model must have at least one related event model. Metrics only measure events; parent model columns, traits, and related models that aren’t events don’t appear as options.
- You must have permission to create schema objects on the parent model. Parent models you don’t have permission for appear in the list but can’t be selected.
Create a metric
Start a new metric
- Go to Intelligence > Metrics.
- Click Add metric.
Select a parent model
Select the parent model whose members you want to measure. The metric is available only on charts, experiments, and audiences that use this parent model.
Define how the metric is calculated
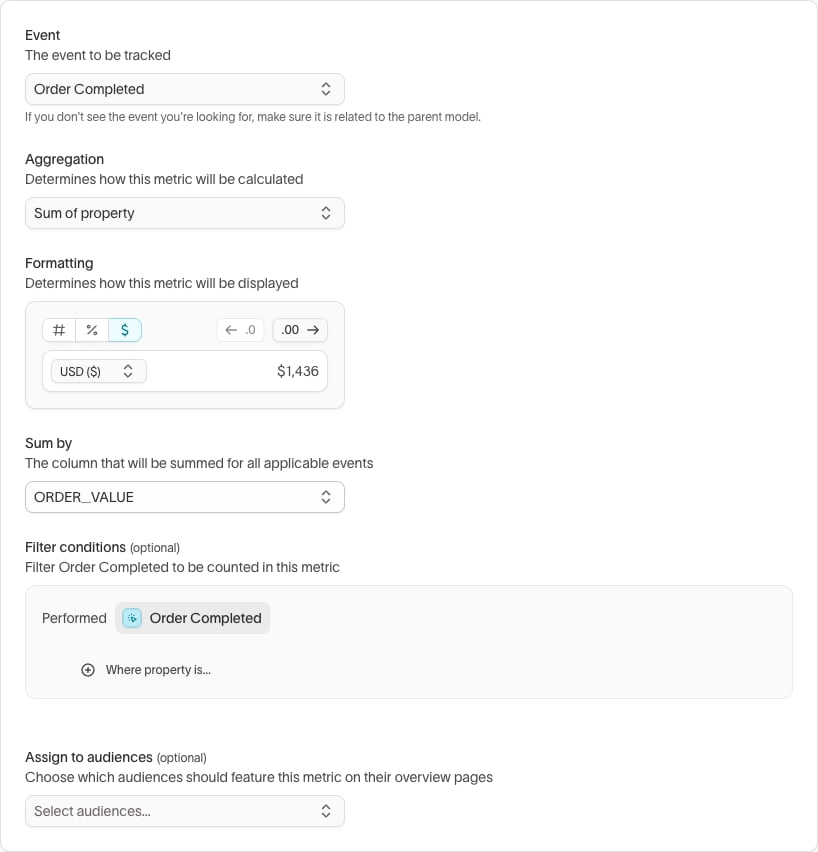
- Under Event, select the event to measure.
- Under Aggregation, select how to combine the events. See Choose an aggregation.
- If the aggregation uses a property, select the property under Sum by or Count by.
- Under Formatting, choose how values display. See Choose a display format.
- Optional: under Filter conditions, add conditions on event properties to limit which events count. See Decide which events count.
-
Click Continue.
Name and save the metric
- Enter a Metric name. Use the name people search for in a chart, such as
Total revenueorPurchase rate. - Optional: enter a Metric description that says what’s included and excluded, such as “Completed orders only, excludes refunds.”
- Click Finish.
Save a metric from a chart
If you’ve already built the calculation in an Insights chart, you can save it without starting over:- From an event — In the chart’s Metrics panel, after you select an event and configure it, click the star icon (Save metric). Enter a Name and optional Description, then click Save metric.
- From a modified saved metric — If you change the filters on a saved metric in a chart, the metric shows a Modified badge. Click Create metric to save the changed version as a new metric, or Clear changes to go back to the saved definition.
Choose an aggregation
The aggregation decides what the number means. Pick it by the question you’re answering:
A few distinctions decide most choices:
- Total events vs. Unique members. A member who buys three times counts three times in Total events and once in Unique members. Use Unique members or % of audience when you care about reach; use Total events when you care about volume.
- Average of property vs. Sum of property per member. Average of property averages across events, so frequent buyers weigh more. Sum of property per member totals each member’s value first, then averages across members, so it answers “how much is a typical member worth?”
- % of audience is the share of members in a chart’s segment who performed the event. Segment the chart by an audience to see that audience’s rate, such as its purchase rate.
Choose a display format
Formatting sets whether the metric’s values display as a number, a percentage, or a currency. It doesn’t change the calculation. Insights charts, experiments, and audience overviews show the raw value without this format, so a revenue metric set toUSD still appears as a plain number in a chart.
- Choose currency for money values, then select the currency code, such as
USDorEUR. - Choose percentage when the property already stores a rate, such as a discount rate stored as
0.15. - Use the decimal place buttons to show up to four decimal places. The preview shows how a sample value looks.
Decide which events count
Without filters, a metric includes every row of the event. Add Filter conditions when part of the event shouldn’t count toward the KPI, for example:- Only orders where
statusequalscompleted, so refunds and cancellations don’t inflate revenue. - Only page views where
page_typeequalsproduct, so you measure product interest rather than all browsing. - Only email clicks where
campaign_typeequalspromotional.
Example: track revenue from completed orders
Suppose your schema has a Customers parent model with a related Order Completed event that includesORDER_VALUE and STATUS columns. Your team wants one revenue number everyone uses.
- Go to Intelligence > Metrics and click Add metric.
- Select the Customers parent model.
- Set Event to Order Completed.
- Set Aggregation to Sum of property, then set Sum by to
ORDER_VALUE. - Under Formatting, choose currency and select
USD. - Under Filter conditions, add a condition where
STATUSequalscompleted. - Click Continue, name the metric
Total revenue, and add the descriptionSum of ORDER_VALUE for completed orders. - Click Finish.
Use metrics across Intelligence
After you save a metric, it appears wherever you choose a metric for the same parent model:- Insights charts — Select the metric in the chart’s Metrics panel. The aggregation is fixed by the metric, but you can adjust the Measurement window and Filter events for that chart without changing the saved definition.
- Experiments — Choose the metric as an experiment’s Primary metric, which decides whether the treatment won, or add it under Secondary metrics to track other outcomes.
- Dashboards — Save a chart that uses the metric, then add the chart to a dashboard.
- Audience overviews — Select the metric under Primary metrics in an audience’s settings to show it as a KPI on the audience’s overview page. When you create a metric, you can also pick audiences under Assign to audiences.
Tips and troubleshooting
An event is missing from the Event list
The Event list only includes event models related to the parent model you selected. If an event is missing, check that it’s set up as an event model with a relationship to that parent model in your schema. If it belongs to a different parent model, create the metric on that parent model instead.A property is missing from Sum by
Sum by lists only number properties, because summing and averaging need numeric values. If a column such asorder_total is missing, check its type in the event model. A column stored as text needs to be cast to a number, for example in the event model’s SQL.